A Look at Registration and Turnout Rates in the 2016 Elections Performance Index
The MIT Election Data and Science Lab manages the Elections Performance Index (EPI), an objective, nonpartisan assessment tool evaluating U.S. election administration. Following the recent update to the index with data from 2016, we are dedicating a series of posts to exploring the EPI’s underpinnings.
Our post today was penned by Barry Burden, who contributed to the original development of the index.
There is little doubt that voter registration and turnout rates belong among the 17 indicators that make up the 2016 Elections Performance Index. While election performance should be judged on much more than how many people are registered and how many voted, these two indicators carry weight as markers of healthy elections.
How to Measure Turnout and Registration
Nearly all research on voter turnout now relies on the measure developed by professor Michael McDonald, which takes the number of votes cast for the highest office on the ballot and divides it by the “voting eligible population” (VEP). The VEP is an estimate that adjusts the more familiar “voting age population” by subtracting non-citizens and ineligible felons, and adding eligible voters living abroad.
As I explained in a chapter of The Measure of American Elections, the registration rate is a surprisingly difficult concept to measure. Unlike other indicators in the EPI, registration is in constant flux. New people are continuously added to the rolls and existing records are removed by election officials in an ongoing effort to keep the voter files accurate. In addition, many states define an intermediate status known as “inactive” registration that is sometimes considered less than being fully registered but other times is lumped in with “active” registration numbers.
In part because of these complications, the EPI uses a survey-based measure of the registration rate from the Current Population Survey (CPS) of the U.S. Census Bureau. Surveys are not ideal because respondents tend to over-report being registered, but they remain preferable to other official sources that suffer from different limitations. This might shift over time as the CPS receives more scrutiny and state records become more reliable and consistent across the country.
Turnout Varies a Lot More than Registration
Despite the unusual nature of the 2016 presidential campaign, voter turnout again showed a familiar amount of variability across states. Closely following the order of states in previous elections, turnout rates in 2016 ran from a low of 43% (in Hawaii) to a high of 75% (in Minnesota). This variability can be summarized by the standard deviation, a measure of how much the typical state deviates from the average. The standard deviation in 2016 was 6.3 percentage points, which is close to the average in recent presidential elections.
This contrasts with midterm elections, where variability in turnout is usually higher. Aside from the 2010 election, which appears to be an outlier, the standard deviation in midterms is about two percentage points higher than in presidential elections.
These extreme examples remind us that although turnout is of great normative interest, election officials have limited ability to control it. The scatterplot below shows that turnout is often higher in states where the election is most competitive, here indicated by the share of the two-party vote that Donald Trump won. Turnout peaked in battleground states where Hillary Clinton and Donald Trump were nearly equally matched; it fell off in lopsided states where one candidate won easily.
Observers are right to pay attention to whether voter turnout goes up or down from one election to the next. But it is also important to understand that changes over time are quite small compared to the differences that exist across states in a single election year. In the nine presidential elections from 1980 to 2016, the national turnout rate ranged from 51.7% to 61.6%, a span of about 10 percentage points. Across the states in 2016 alone, the range was three times that large.
Registration rates, as least as measured by the CPS, vary less than turnout rates do. In 2016, the share of the people reporting they were registered varied across the states by 21.7 percentage points with a standard deviation of 4.2. As a result, turnout rates do more to differentiate states’ election performance ratings.
Slippage between the Two
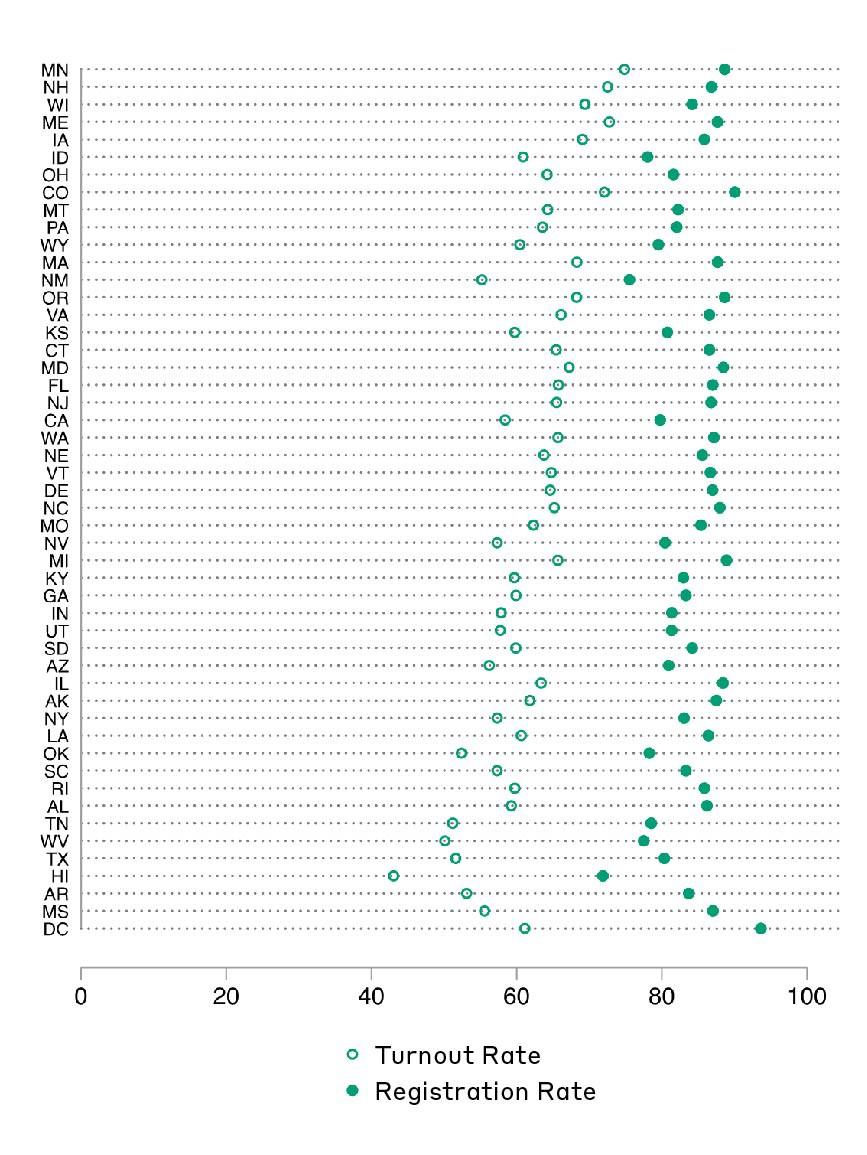
It is little surprise that states with higher registration rates also tend to have higher turnout rates, yet the connection between the two is not perfect. In 2016 the correlation was 0.73 (where 1.0 would indicate the strongest possible relationship).
I refer to the drop off between the registration rate and the turnout rate as “slippage.” The figure below shows the states in order according to their slippage in the 2016 election. In the average state, the turnout rate was 27.8 points lower than the registration rate, meaning that more than one in four registrants did not vote. Yet the gap between registration and turnout rates was less than 15 points in Minnesota, New Hampshire, Wisconsin, and Maine. It might not be a coincidence that all of these states have election day registration and were politically competitive, as shown in the previous figure. Slippage was much greater in Arkansas (30.6 points), Mississippi (31.5 points), and the District of Columbia (32.5).
Administrative Consequences of Turnout
Most people would agree that higher voter turnout is a normatively good thing, yet election officials might also be concerned that a high volume of voters could have negative side effects for other aspects of the election system. In particular, there might be concern that high turnout could lead to longer waiting times as voters clog the polling places.
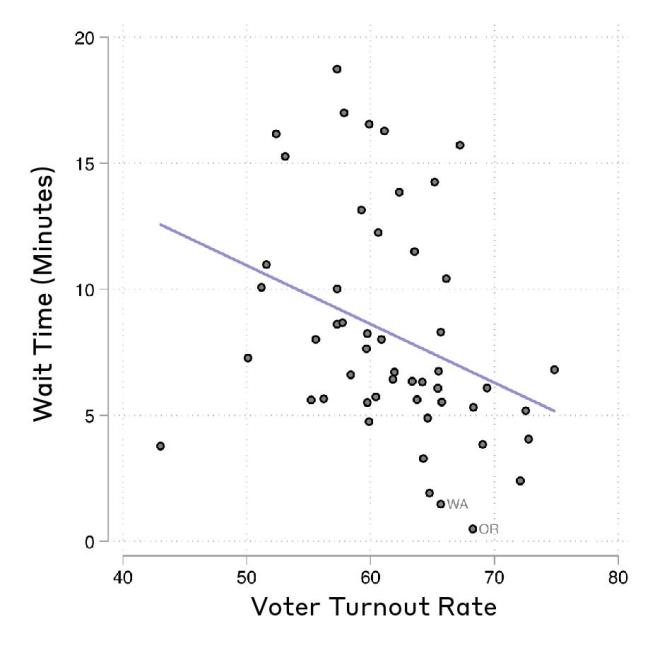
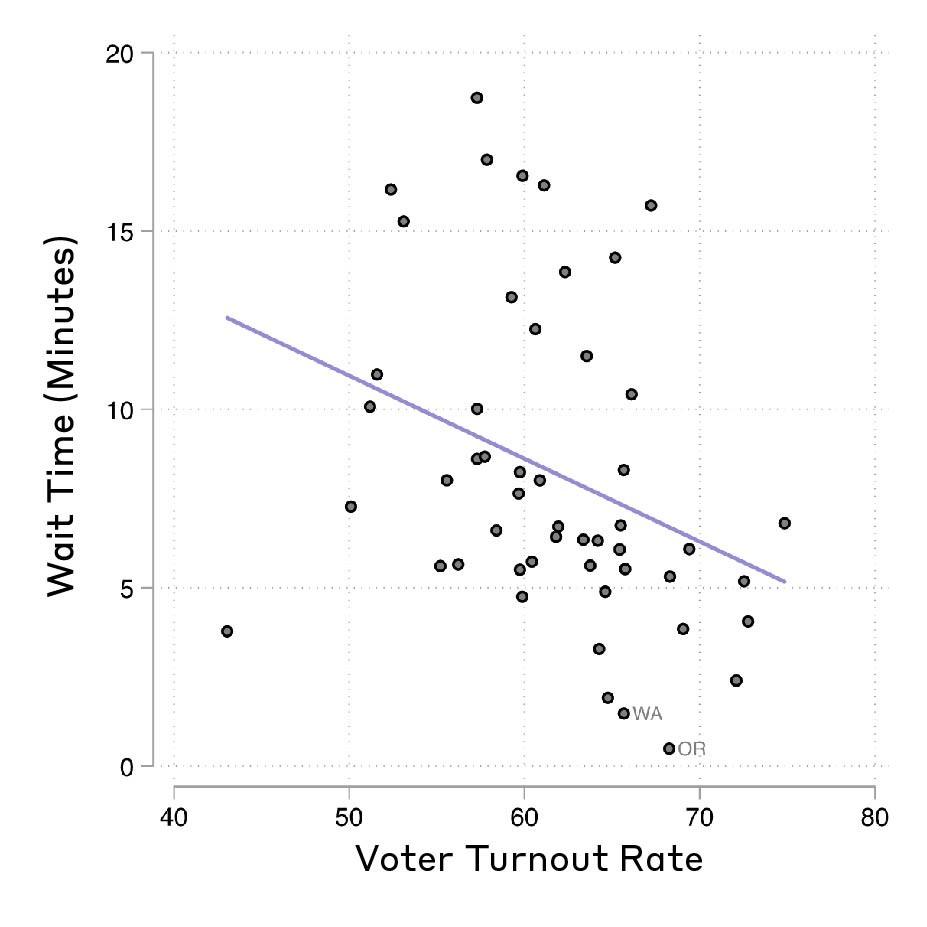
The figure below demonstrates this is not the case. In states with a higher volume of voters, waiting times were actually shorter than in states that had lower turnout rates. The correlation is between the two variables is -0.33. If the two “vote at home” states of Oregon and Washington are removed from the analysis, the correlation weakens only slightly to -0.29.
It seems likely that states with higher turnout also do other things that make them perform admirably when it comes to wait times. Election administration is multifaceted, and the EPI provides a useful diagnostic tool for state officials and researchers to identify what is working well and where there is room for improvement.


